


If Nothing Changes
PROJECTION OF THE “THREE CITIES” IN TORONTO TO THE YEAR 2025
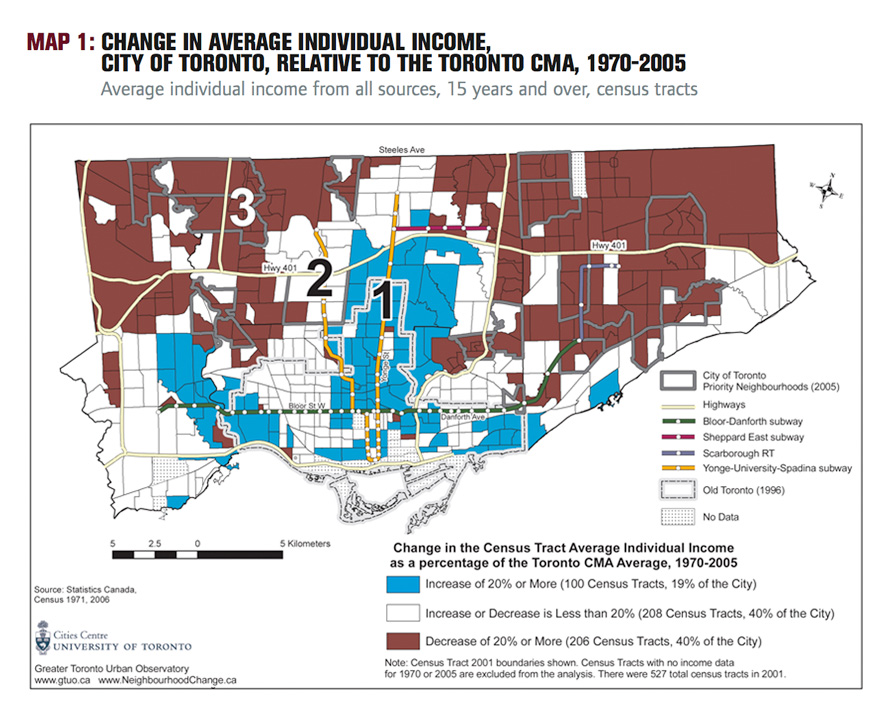
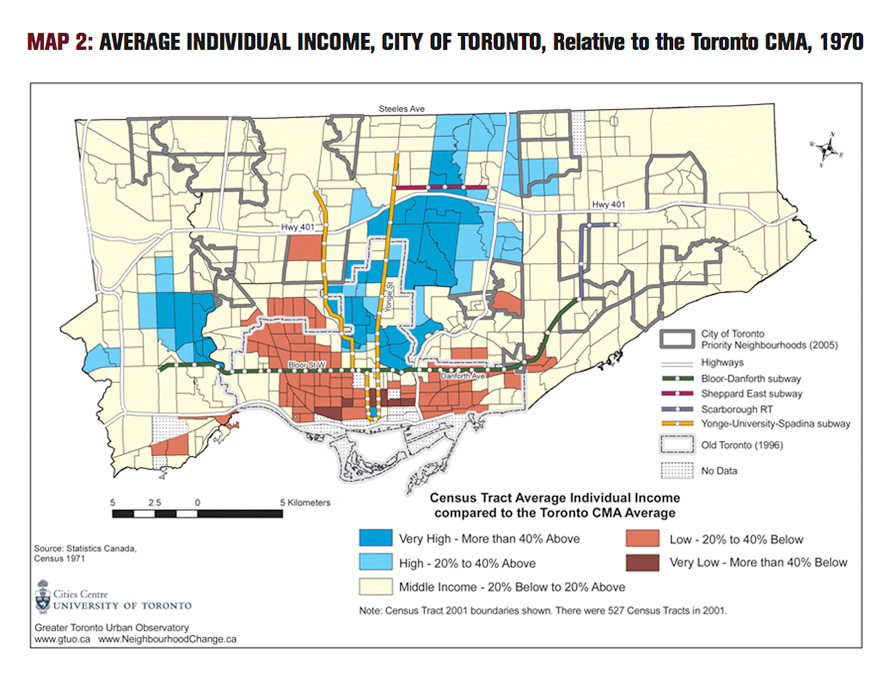
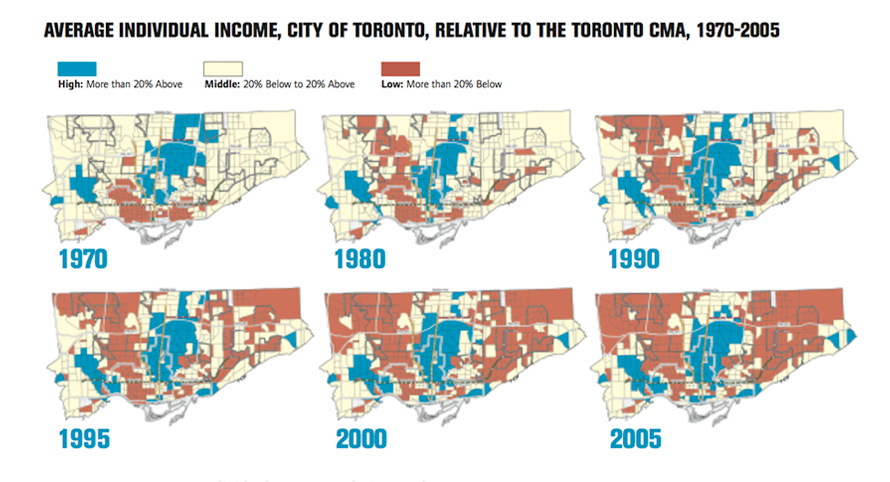
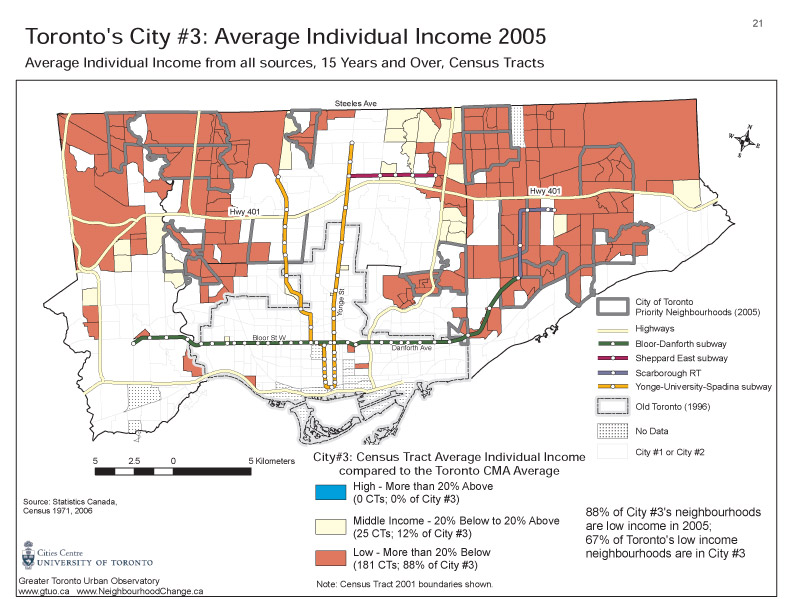
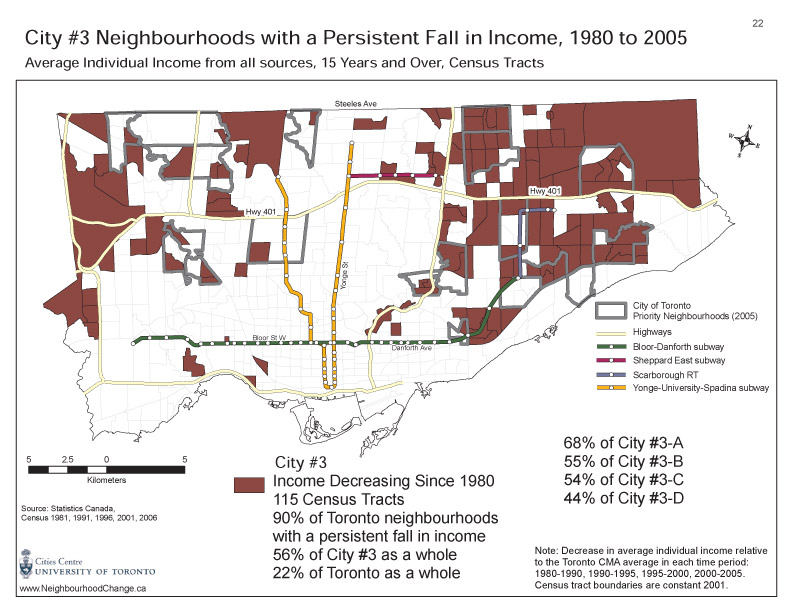
 Map 1 in this report shows trends in average individual income for Toronto’s neighbourhoods (census tracts) from 1970 to 2005. What happens to the spatial patterns of the “Three Cities” in Map 1 if we project these trends forward in time — say by 20 years, to 2025? Do more neighbourhoods within the City of Toronto show either a downward or upward trend in income relative to the Toronto CMA? Map 7 indicates clearly that this is what would happen under the assumptions outlined below.
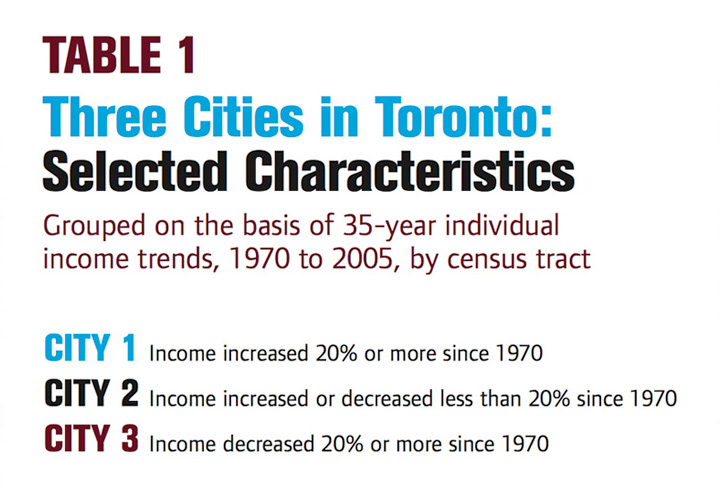
Projections are based on certain assumptions about future change. Sometimes these are referred to as “scenarios.” The text in the box shows the assumptions upon which the projection in Map 7 is based. For City #1 (increasing income) and City #3 (decreasing income), it is assumed that no census tracts will
leave either group. The question then becomes: what will happen to census tracts in City #2 during this 20-year period? Three possibilities for City #2 are combined to produce the projection in Map 7.
First, we assume that City #2 census tracts that increased between 5% and 20% in income in the 1970–2005 period will continue to increase relative to the Toronto CMA; they will reach the 20% threshold by 2025, thereby joining City #1. Second, we assume that City #2 census tracts that decreased between 5% and 20% will continue to decrease and reach the 20% threshold, thereby becoming part of City #3. Third, we assume that City #2 census tracts that increased or decreased less than 5% in income between 1970 and 2005 will remain in City #2.
The outcome of this scenario is shown on Map 7, with the numerical summary provided below the map. By 2025, if nothing is done to change current trends:
– City #1 will include 30% of the city’s census tracts, compared
with only 19% in 2005;
– City #3 will comprise 59% of the city’s census tracts, an
increase from 40% in 2005;
– City #2 will decrease dramatically from 40% of the total in
2005 to 9% in 2025.
Thus, the number of census tracts in Cities #1 and #3 will increase substantially at the expense of City #2.
 How do these trends translate into the projected spatial distribution of the “Three Cities”? In comparing Map 1 and Map 7, we see that both Cities #1 and #3 have expanded dramatically at the expense of City #2. City #3 now includes almost all of Scarborough, the northern fringe of North York, and almost all of Etobicoke north of Eglinton Avenue, as well as large parts of the former municipalities of York and East York. Most of the isolated census tracts that were part of City #2 in 2005 have now joined City #3. These neighbourhoods will increasingly attract newcomers, especially low-income immigrants, who cannot afford housing in the central city or the outer suburbs.
City #1 has grown to cover most census tracts close to the northsouth and east-west subway lines. By 2025, these census tracts will become increasingly desirable areas of the city, attracting higherincome
residents who want good access to downtown Toronto by public transportation and the amenities of a central location. With the exception of a few pockets of social housing or lower-cost private rental high-rise units built in the 1960s, the area south of the east-west subway line is now almost entirely part of City #1. This change will have been brought about by two ongoing trends: (1) the creation of more condominium apartments, either newly constructed or carved out of abandoned industrial space, and (2) the continued gentrification of older, low-rise residential neighbourhoods. Both of these types of residential areas attract a higherincome population.
In the meantime, City #2 has been reduced to a few census tracts, mostly found between Cities #1 and #3. As a result, the “Three Cities” model is approaching a “Two Cities” model, in which neighbourhoods are sharply divided between those in which average individual incomes have increased dramatically over the 1970 to 2025 period and neighbourhoods where the opposite has occurred.
Of course, this is just one scenario based on current trends. It assumes no changes to Cities #1 and #3, and that many census tracts in City #2 will move upwards or downwards to become part of Cities #1 or #3. In other words, it assumes no major policy changes in the next 20 years, especially policies that might lead to a more equal income distribution and a more equitable spatial distribution of an increased supply of affordable housing. This is a reasonable assumption, since neither of these changes is on the immediate horizon.
— Robert A. Murdie, Geography, York University and Neighbourhood Change CURA, Cities Centre, University of Toronto

Map 7, PDF

Map 1, PDF