


07. A blip or a trend?

Change is a constant in a dynamic city like Toronto. People move in and out of neighbourhoods in the context of everchanging economic, social, and government policy conditions. Are the trends identified here the result of a persistent pattern, or might they be a random result?
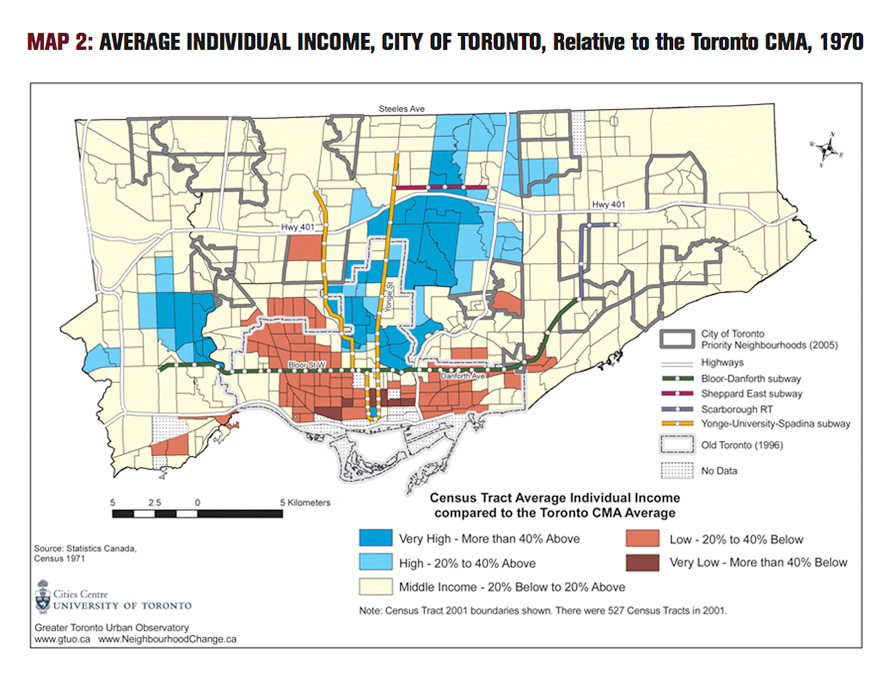
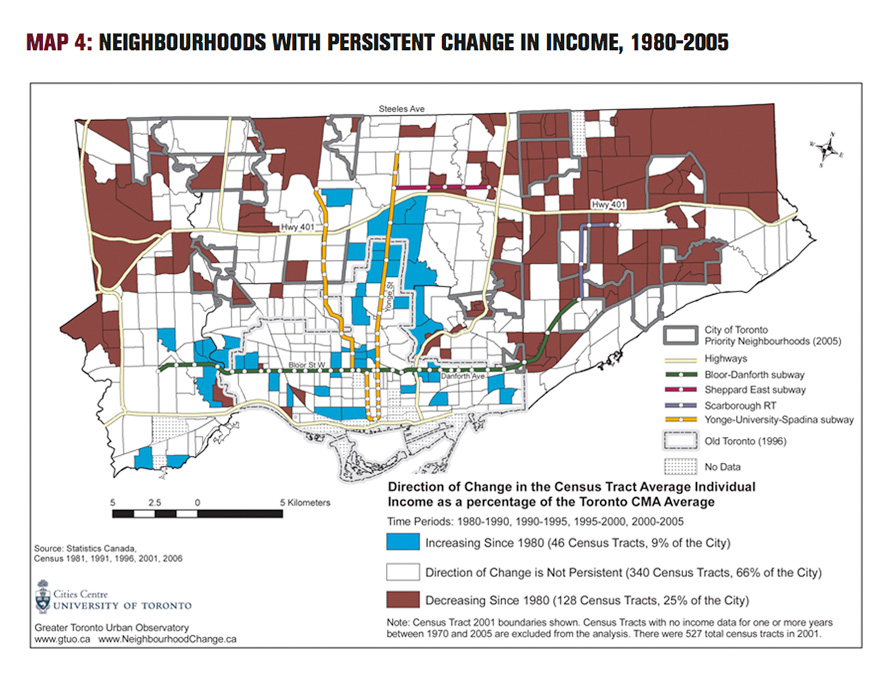
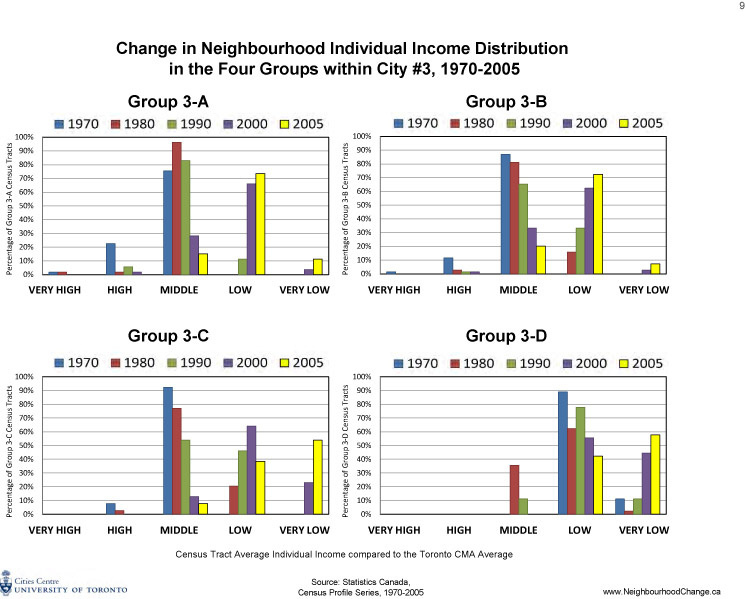
The results show that these three relatively consolidated and distinctly different cities within the City of Toronto have emerged, to a large extent, in a persistent manner. Many neighbourhoods have consistently gone up or down in average individual income compared to the CMA average individual income during each census period we studied. That is, there is no evidence that the changes represent temporary fluctuations or aberrations.
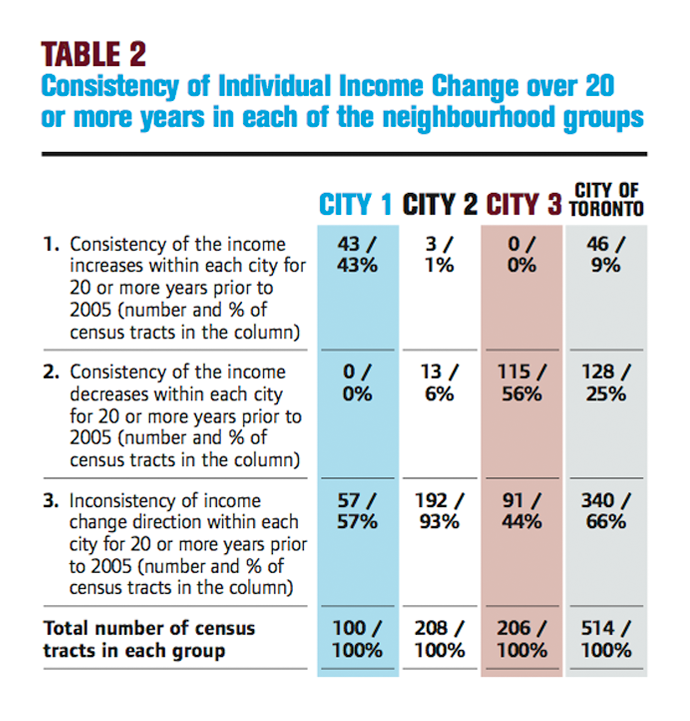
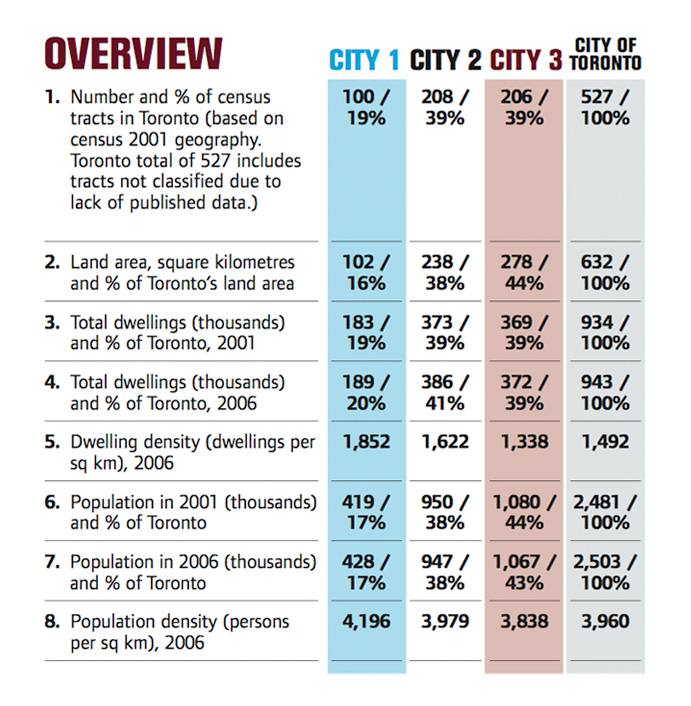
In the entire City of Toronto, over the 25 years from 1980 to 2005, for example, only 9% of all census tracts went up in average individual income consistently. Most of these are in City #1, where average incomes in 43% of the City #1 census tracts have been consistently rising for 25 years or more compared to the CMA average (Table 2, line 1).
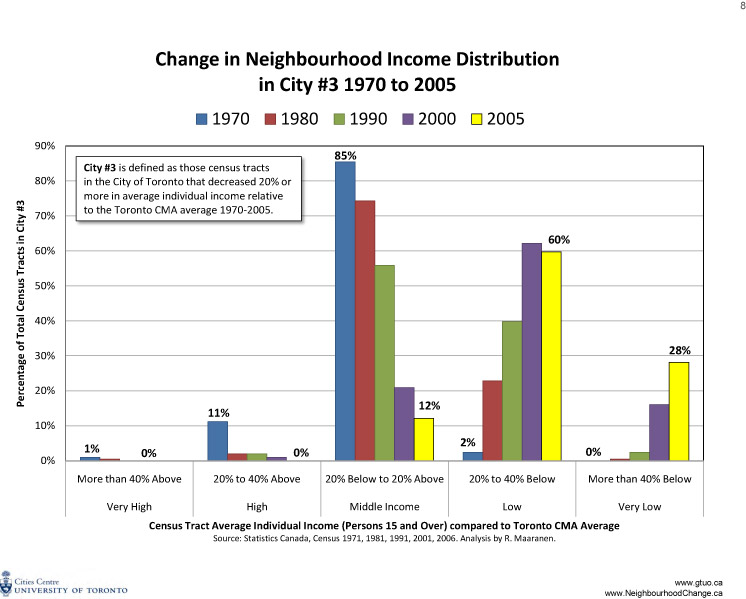
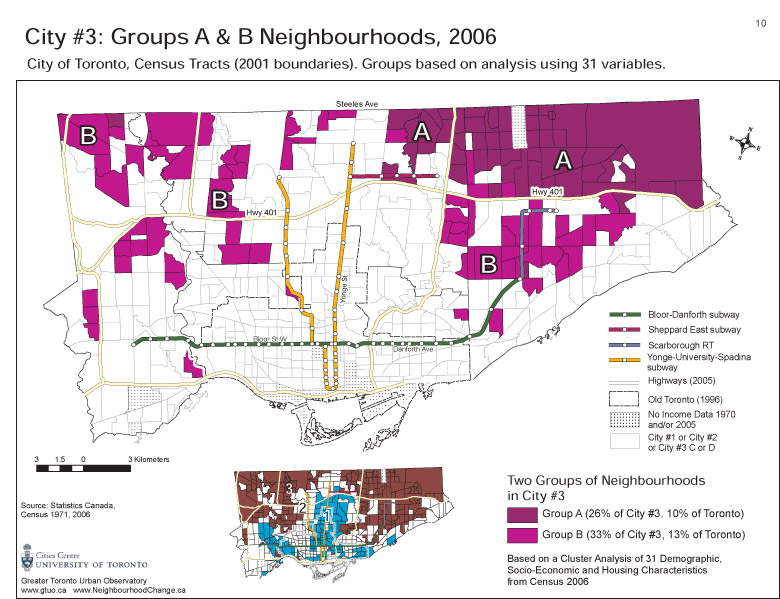
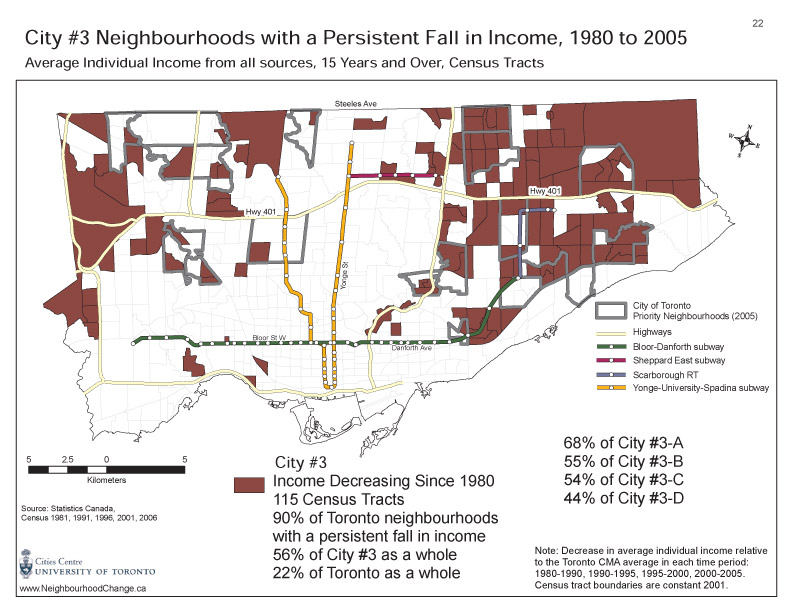
The same holds true for census tracts in which average incomes are falling. In the City of Toronto, in 25% of all census tracts, average individual income consistently went down relative to the CMA average during each census period; most of these census tracts (115 out of 128) are in City #3 (Table 2, line 2).
The trends in City #2 are less consistent. Only 8% of City #2’s census tracts show a consistent pattern over the last 25 years (Table 2, line 3). Of these, three-quarters have shown a consistent fall in average income in each census period. This suggests that some of the census tracts in City #2 will eventually become part
of City #3. At the same time, some of the increases in incomes and housing prices occurring in City #1 could very well result in spillover gentrification into adjacent, relatively low-income census tracts that are part of City #2, as these areas become more attractive to middle- and upper-income people.
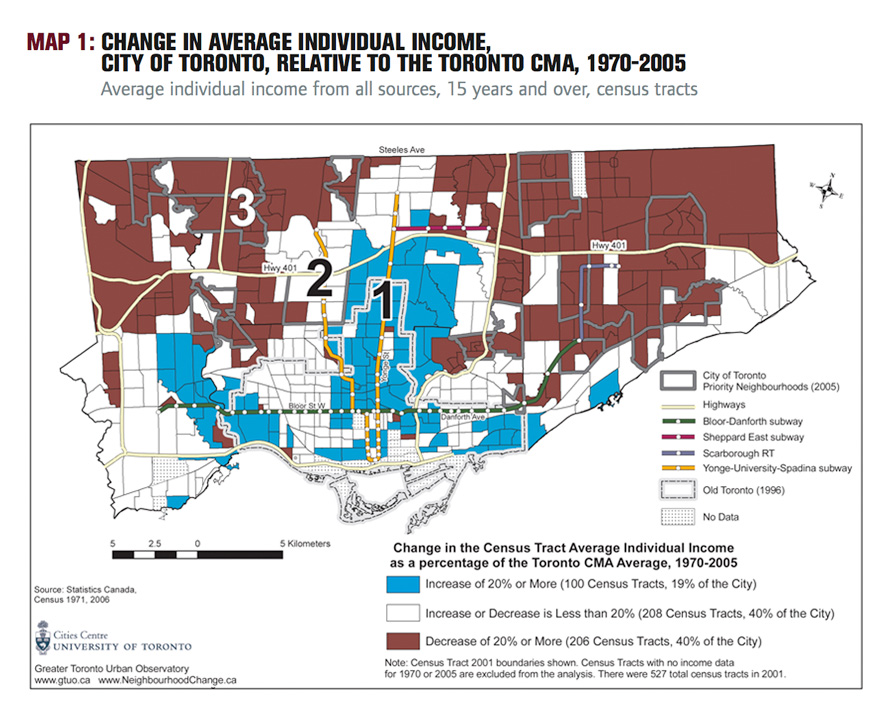
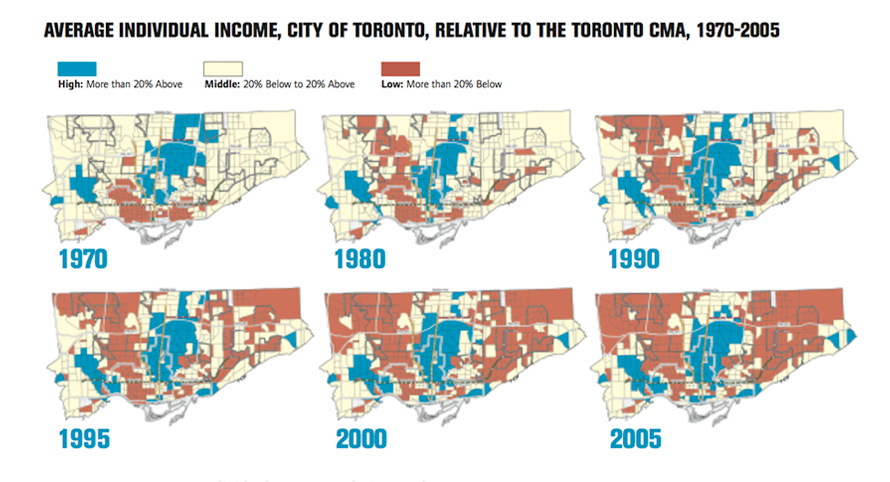
A map showing only census tracts that have persistently gone up or down for 25 years or more (Map 4) looks very similar to Map 1. Our conclusion that the City of Toronto has polarized into three distinct cities is based on these long-term persistent trends.