


08. What has changed in Toronto between 2001 and 2006? The most recent two censuses

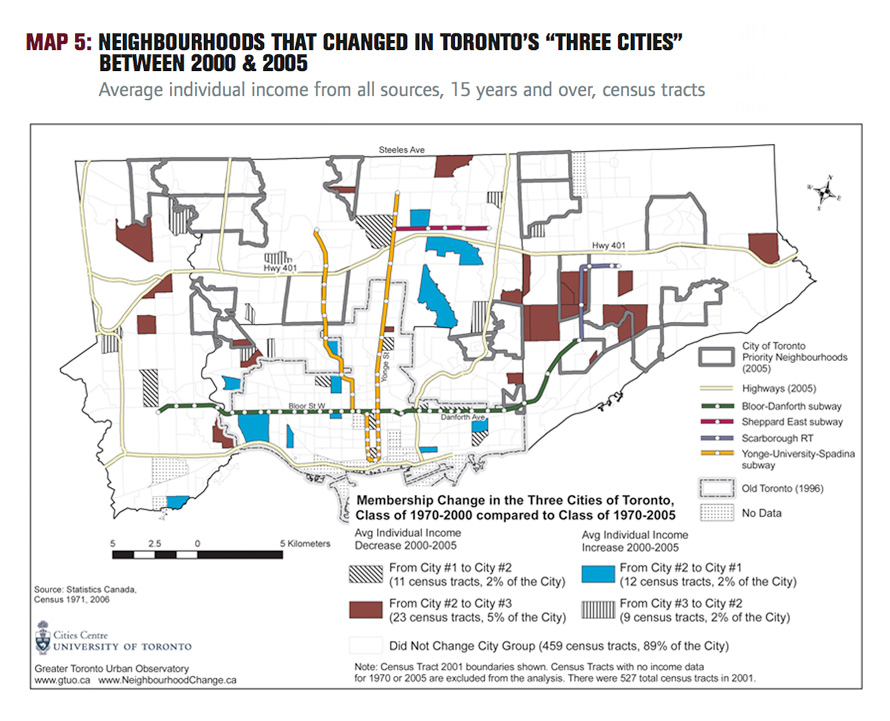
Five years is a relatively short time for large-scale demographic change to take place, even in a city like Toronto that during the post Second World War period has often experienced sudden and dramatic change. Therefore, it is not surprising that most census tracts (89%) remained in the same group between 2001 and 2006 — that is, the “Three Cities” remained largely the same in 2006 as in 2001.
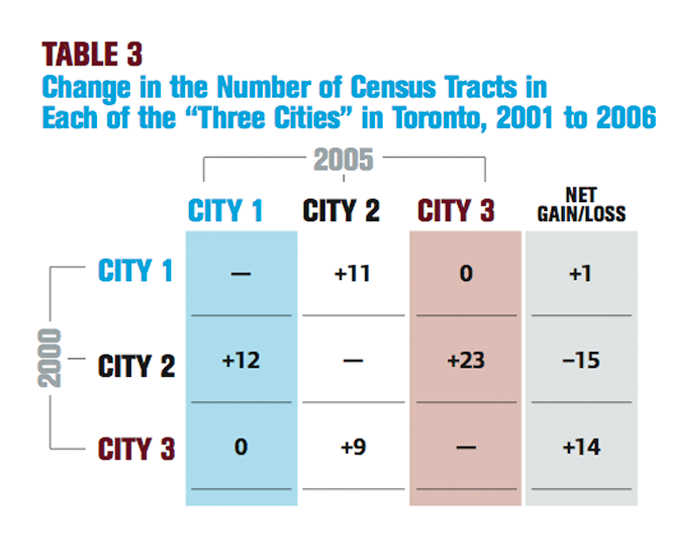
What about the 11% of census tracts that did change from one group to another during this period? The details of the transition are shown in Table 3 and Map 5. Table 3 shows the net result in terms of gains and losses of census tracts in the “Three Cities.” City #2 experienced a net loss of 15 census tracts during
this period and therefore shrank in size. During the same period, City #3 had a net gain of 14 census tracts and increased in size. City #1 achieved a net gain of one census tract, gaining 12 census tracts from City #2 but losing 11 census tracts to City #2. No census tracts jumped from City #1 to City # 3 or vice versa.
As noted in Map 5, 34 census tracts experienced a decrease in average individual income compared to the Toronto CMA, with 11 census tracts shifting from City #1 to City #2 and 23 census tracts from City #2 to City #3. Spatially, the result of the shift from City #2 to City #3 was a further consolidation of census tracts in City #3, especially in central Scarborough and to a lesser extent, northern Etobicoke.
At the opposite extreme, 21 census tracts underwent an increase in average individual income compared to the Toronto CMA, with 12 census tracts being reclassified from City #2 to City #1 and 9 census tracts from City #3 to City #2. The former include areas of emerging gentrification such as Roncesvalles, High Park, and South Riverdale, while the latter are generally at the edge of former City #3.
Although changes in the “Three Cities” maps between 2001 and 2006 are relatively minor, the changes reinforce earlier findings because they represent a decline in the number of middle-income neighbourhoods and an increase in the number of low-income neighbourhoods. Although the overall number of high-income neighbourhoods remained stable over the five years, the results show a continuing trend towards the creation
of a city with increasing disparities between rich and poor neighbourhoods.

Map 5, PDF