Overview
Toronto’s neighbourhoods fall into three clear groups based on income change, 1970 to 2005.
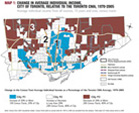
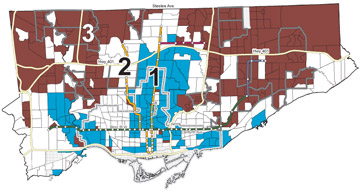 The first, which we call City #1, is a predominantly high-income area of the City of Toronto in which neighbourhood incomes have risen a great deal relative to the Toronto Census Metropolitan Area (CMA) average since 1970; these neighbourhoods are generally found in the central city and close to the city’s subway lines. By contrast, City #3 is a generally low-income area of Toronto, in which neighbourhood incomes have fallen substantially over the past few decades compared to the CMA average; these neighbourhoods are found mostly in the northeastern and northwestern parts of Toronto. In between these two is City #2, a mainly middle-income area, where neighbourhood incomes have remained fairly close to the CMA average since 1970. While all cities can be divided into various groupings, the important finding in this research is the consistent trend over time: the three groups of neighbourhoods are changing at different rates and moving further apart.
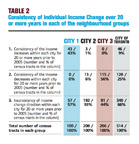
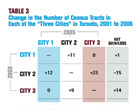
The middle-income area of the city shrank dramatically between 1970 and 2005, while the highincome area increased slightly and the low-income area increased substantially.
Based on comparisons of neighbourhood income with the CMA average, the proportion of middleincome neighbourhoods (incomes less than 20% above or below the CMA average in each year) was 66% in 1970, but only 29% in 2005. Meanwhile, over the same period, high-income neighbourhoods (neighbourhood incomes 20% or more above the CMA average) grew from 15% of the city’s neighbourhoods to 19% and low-income neighbourhoods (neighbourhood incomes 20% or more below the CMA average) grew from 19% of the city’s neighbourhoods to 53% (extremely low-income neighbourhoods grew from 1% to 9%). Middle-income households have not simply moved to suburban municipalities beyond Toronto, because a similar trend can be seen in the rest of the Toronto CMA.
Poverty has moved from the centre to the edges of the city.
In the 1970s, most of the city’s low-income neighbourhoods were in the inner city. This meant that low-income households had good access to transit and services. Some of these neighbourhoods have gentrified and are now home to affluent households, while low-income households are concentrated in the northeastern and northwestern parts of the city (the inner suburbs), with relatively poor access to transit and services.
These are long-term trends.
The study looked at trends for a 35-year period, and found most of the changes to be persistent. The polarization of the city into wealthy neighbourhoods and greater numbers of disadvantaged neighbourhoods is continuing and middle-income neighbourhoods are disappearing.
The segregation of the city by income is not inevitable or irreversible.
These trends could be slowed or reversed by public policies that would make housing more affordable to low-income households, by efforts to expand access to transit and services in neighbourhoods where the need is greatest, and by renewing the aging high-rise neighbourhoods scattered throughout City #3 (e.g., by the Tower Neighbourhood Renewal initiative: www.TowerRenewal.ca).
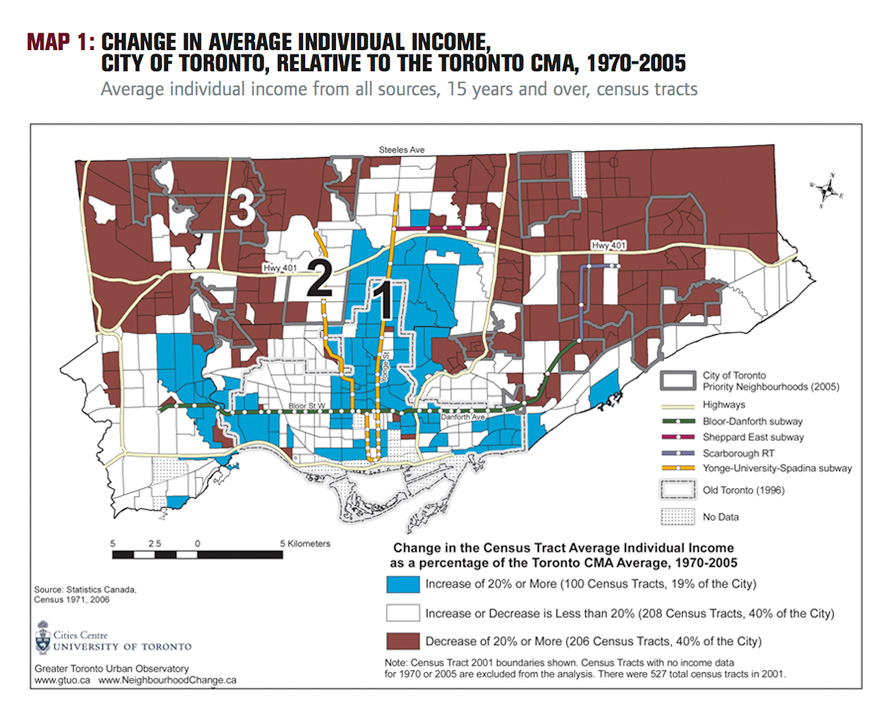
Map 1, PDF
