06. Characteristics of the three cities in Toronto
Income is only one defining characteristic of the socioeconomic status of individuals and neighbourhoods. The
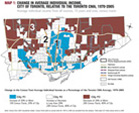
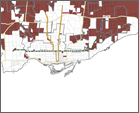
three cities shown in Map 1 also differ on other important characteristics. see table 1
Population City #1, City #2, and City #3 contain 17%, 38%, and 43%, respectively, of Toronto’s total population (see Table 1). City #3 has had the largest population increase over the 35 years, because many parts of City #3 were underdeveloped in 1970. However, in the five years between 2001 and
2006, the population of City #2 and City #3 declined slightly, while the population of City #1 increased, primarily because of new residential condominium development in the central area of the city.
Households City #1 households are smaller (2.3 persons per household on average), and there are more one-personhouseholds and fewer two-parent families with children than in the other two cities. City #3 has a higher percentage of singleparent families than City #1 (23% versus 14%) and also a higher percentage of children and youth (33% versus 26%). Overall, there has been a citywide 35-year decline in the proportion of children and youth under 25 years old as a percentage of the population, from 43% to 29%.
Housing tenure Renters are found in most areas of the city, but are particularly prevalent in City #3, where they account for almost half of all households. Renter households spend much more of their income on housing than owners do. In City #3, for example, 47% of renters and 32% of owners spent more than 30% of household income on housing in 2006. In City #1, the gap is even wider, with 41% of renters and 21% of owners spending more than 30% of household income on housing. City #2 is between these two, close to the citywide average.
Immigrants In City #1, the percentage of foreign-born people declined from 35% to 28% between 1971 and 2006, whereas in City #3 the number of immigrants increased dramatically over the 35-year period from 31% of the population in 1970 to 61% in 2006. In 2006 City #2 is close to the citywide average of 50%.
Visible minorities City #1 is mainly white (82%) whereas only 34% of City #3’s population is white. City #1 has very few Black, Chinese, or South Asian people, who are disproportionately found in City #3. Only 11% of City #1 compared to 47% of City #3 are Black, Chinese or South Asian. In contrast to City #1 and City #3, City #2 is close to the overall City of Toronto average with respect to visible minority population.
Education In Toronto as a whole, persons in their twenties and beyond were much more likely to have a university education in 2006 than in 1971. This is especially the case for City #1. In 2006, 61% of residents 25 years and over in City #1 had a university certificate, diploma, or degree, compared to 35% and 31% of the same age group in City #2 and City #3, respectively. Consequently, the relatively large number of well-educated people in City #1 are in a much more favourable position than those in City #2 and City #3 to compete for high-paying white-collar jobs.
Employment As in most post-industrial economies, bluecollar employment in The City of Toronto declined substantially between 1971 and 2005, from 28% to 17%. During the same period, white-collar employment increased from 17% to 40% of all occupations. Most of Toronto’s remaining manufacturing
jobs are located in City #3, with a few in City #2. Not surprisingly, the residential population of City #3 is characterized by more blue-collar employees than City #1. The latter has a largely white-collar population, reflecting its relatively high proportion of university-educated residents.
Income Map 1 and Table 1 show 35-year income trends. City #1 not only has the highest average individual income, but income increased by 99% over the 35 years and by 29% between 2000 and 2005. In City #1, 37% of all households had incomes of $100,000 or more, compared to the citywide average
of 18%. In Cities #2 and #3, average household income as a proportion of Toronto CMA income declined between 1970 and 2005, with City #3 declining the most, by 37%. This shift in income reflects both the lower levels of education among residents of City #3 and their lower occupational status. Not only have incomes declined relative to the Toronto CMA in City #3, this area also has the highest proportion of persons in households with incomes below the Low Income Cut-Off (LICO) level.
Travel Residents of City #3, the neighbourhoods with the lowest average income, have to travel farther to find employment, yet they have the poorest access to the Toronto Transit Commission’s subway stations. Only 19 of the system’s 68 subway stations are within or near City #3 neighbourhoods.
